Chapter 5 Diversity-based class
Diversity is one of the core topics in community ecology. It refers to alpha diversity, beta diversity and gamma diversity.
5.1 trans_alpha class
Alpha diversity can be transformed and visualized using the trans_alpha class.
Creating an object of trans_alpha class can invoke the alpha_diversity data stored in the microtable object.
5.1.1 Example
Creating a trans_alpha object can return two data.frame with the prefix ‘data_’: data_alpha and data_stat.
data_alpha is used for subsequent differential test and visualization.
t1 <- trans_alpha$new(dataset = mt_rarefied, group = "Group")
# return t1$data_stat
head(t1$data_stat)
## The group statistics are stored in object$data_stat ...## The transformed diversity data is stored in object$data_alpha ...| Group | Measure | N | Mean | SD | SE |
|---|---|---|---|---|---|
| CW | Observed | 30 | 1843 | 220.6 | 40.27 |
| CW | Chao1 | 30 | 2553 | 338.1 | 61.73 |
| CW | ACE | 30 | 2716 | 367 | 67.01 |
| CW | Shannon | 30 | 6.308 | 0.5355 | 0.09777 |
| CW | Simpson | 30 | 0.9897 | 0.01305 | 0.002382 |
| CW | InvSimpson | 30 | 198.8 | 108.4 | 19.8 |
Then, we test the differences among groups using Kruskal-Wallis Rank Sum Test (overall test when groups > 2), Wilcoxon Rank Sum Tests (for paired groups), Dunn’s Kruskal-Wallis Multiple Comparisons (for paired groups when groups > 2) and anova with multiple comparisons.
t1$cal_diff(method = "KW")
# return t1$res_diff
head(t1$res_diff)
## The result is stored in object$res_diff ...| Comparison | Measure | Group | P.unadj | P.adj | Significance |
|---|---|---|---|---|---|
| IW - CW - TW | Observed | IW | 0.155 | 0.2791 | ns |
| IW - CW - TW | Chao1 | IW | 0.01696 | 0.05088 | ns |
| IW - CW - TW | ACE | IW | 0.01333 | 0.05088 | ns |
| IW - CW - TW | Shannon | IW | 0.5319 | 0.7978 | ns |
| IW - CW - TW | Simpson | CW | 0.8083 | 0.9094 | ns |
| IW - CW - TW | InvSimpson | CW | 0.8083 | 0.9094 | ns |
t1$cal_diff(method = "KW_dunn")
# return t1$res_diff
head(t1$res_diff)
## P value adjustment method: holm ...## The result is stored in object$res_diff ...| Measure | Method | Group | Letter | MonoLetter |
|---|---|---|---|---|
| Observed | Dunn’s Kruskal-Wallis Multiple Comparisons | IW | a | a |
| Observed | Dunn’s Kruskal-Wallis Multiple Comparisons | TW | a | a |
| Observed | Dunn’s Kruskal-Wallis Multiple Comparisons | CW | a | a |
| Chao1 | Dunn’s Kruskal-Wallis Multiple Comparisons | IW | a | a |
| Chao1 | Dunn’s Kruskal-Wallis Multiple Comparisons | TW | ab | ab |
| Chao1 | Dunn’s Kruskal-Wallis Multiple Comparisons | CW | b | b |
# more options
t1$cal_diff(method = "KW_dunn", KW_dunn_letter = FALSE)
head(t1$res_diff)
t1$cal_diff(method = "wilcox")
head(t1$res_diff)
t1$cal_diff(method = "t.test")
Then, let’s try to use anova.
From v1.0.0, the alpha parameter can be used to adjust the significance threshold (default: 0.05) of multiple comparisons when method is ‘anova’ or ‘KW_dunn’.
t1$cal_diff(method = "anova")
# return t1$res_diff
head(t1$res_diff)
## Perform post hoc test with the method: duncan.test ...## The result is stored in object$res_diff ...| Measure | Method | Group | Letter |
|---|---|---|---|
| Observed | anova | IW | a |
| Observed | anova | TW | a |
| Observed | anova | CW | a |
| Chao1 | anova | IW | a |
| Chao1 | anova | TW | ab |
| Chao1 | anova | CW | b |
The multi-factor analysis of variance is also supported with the formula parameter, such as two-way anova.
t1 <- trans_alpha$new(dataset = mt_rarefied, group = "Group")
t1$cal_diff(method = "anova", formula = "Group+Type")
head(t1$res_diff)
# see the help document for the usage of formula
The plot_alpha function add the significance label by searching the results in object$res_diff instead of recalculating the significance. Now, let’s plot the alpha diversity for each group and include the anova result.
t1$cal_diff(method = "anova")
# y_increase can adjust the distance from the letters to the highest point
t1$plot_alpha(measure = "Chao1", y_increase = 0.3)
t1$plot_alpha(measure = "Chao1", y_increase = 0.1)
# add_sig_text_size: letter size adjustment
t1$plot_alpha(measure = "Chao1", add_sig_text_size = 6, add = "jitter", order_x_mean = TRUE)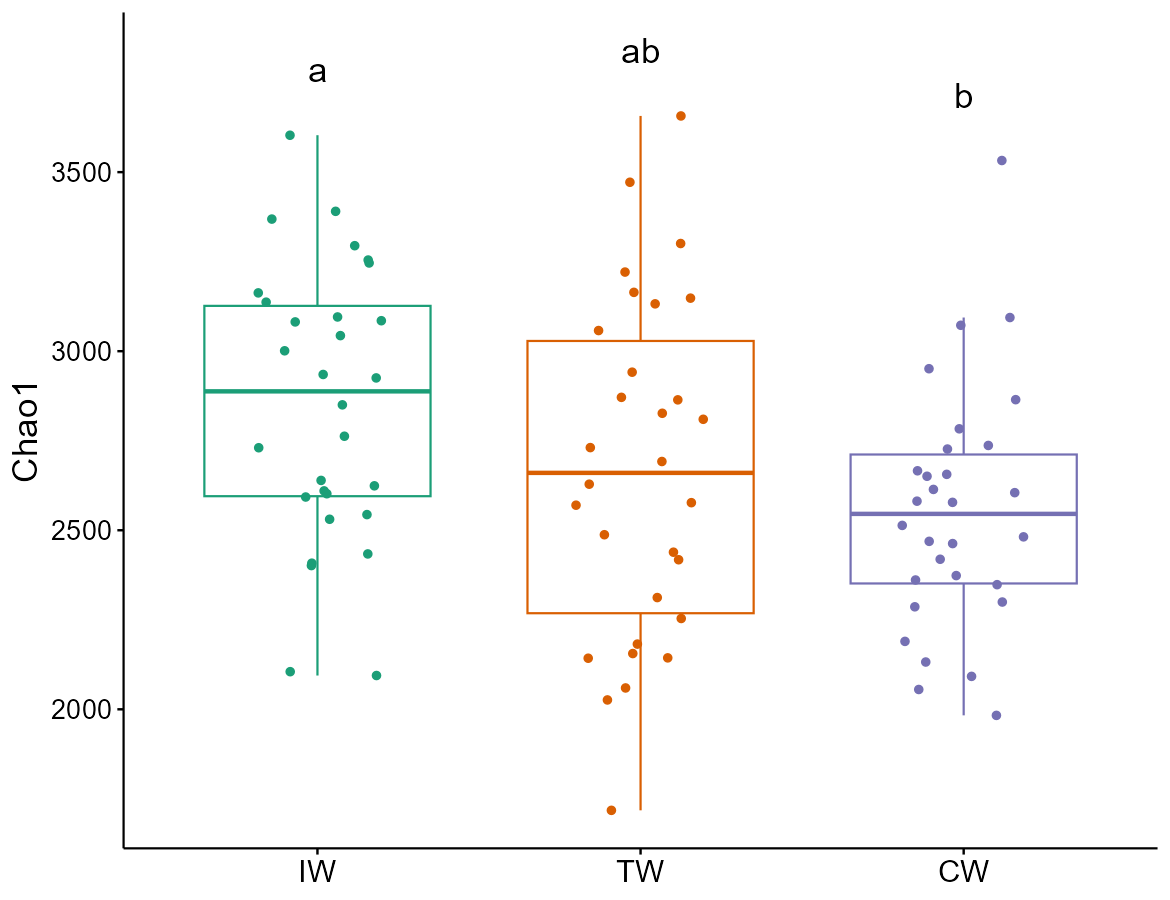
t1$cal_diff(method = "wilcox")
t1$plot_alpha(measure = "Chao1", shape = "Group")
# y_start: starting height for the first label
# y_increase: increased height for each label
t1$plot_alpha(measure = "Chao1", shape = "Group", add = "jitter", y_start = 0.1, y_increase = 0.1)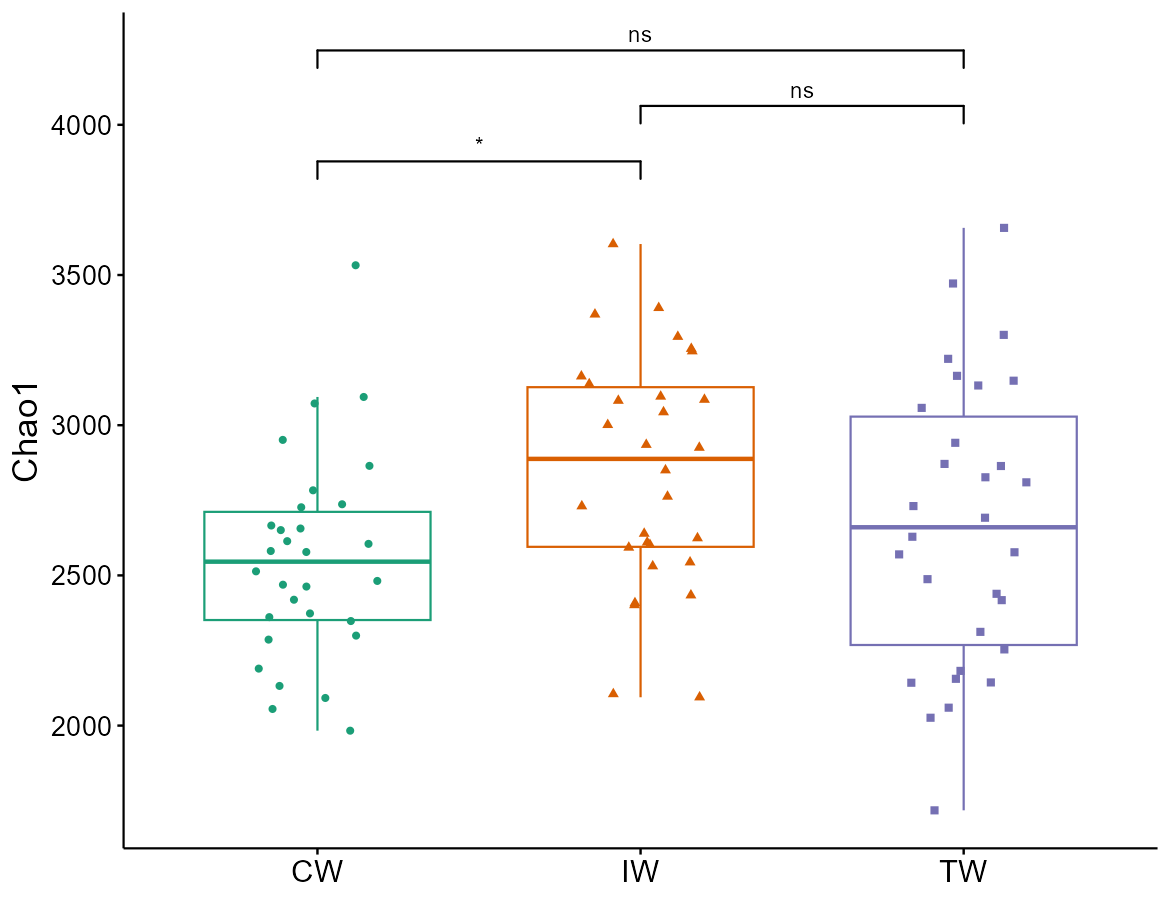
Let’s try to remove the ‘ns’ in the label by manipulating the object$res_diff.
t1$res_diff %<>% base::subset(Significance != "ns")
t1$plot_alpha(measure = "Chao1", add = "dotplot", xtext_size = 15)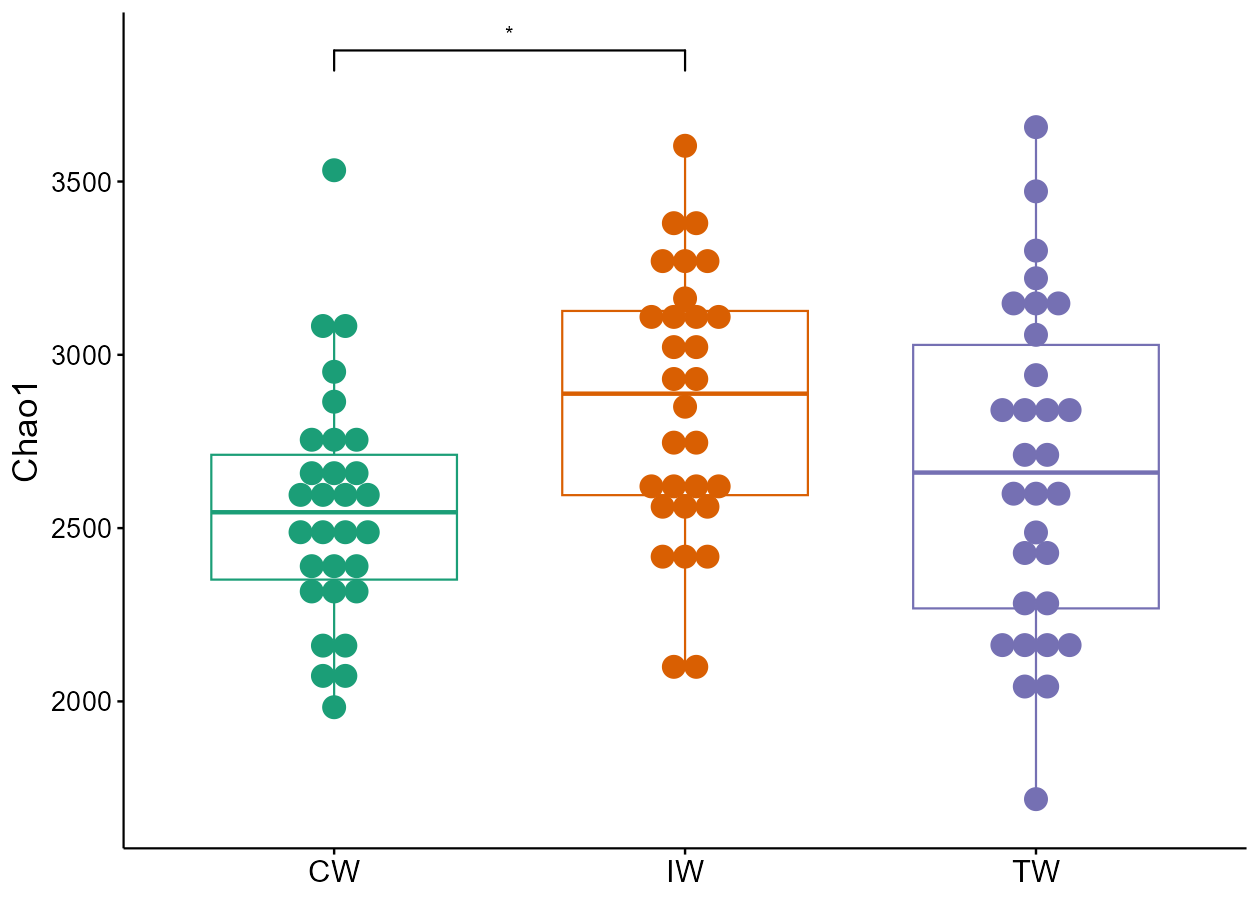
The trans_alpha class supports the differential test of groups within each group using the by_group parameter.
t1 <- trans_alpha$new(dataset = mt_rarefied, group = "Type", by_group = "Group")
t1$cal_diff(method = "wilcox")
t1$plot_alpha(measure = "Shannon")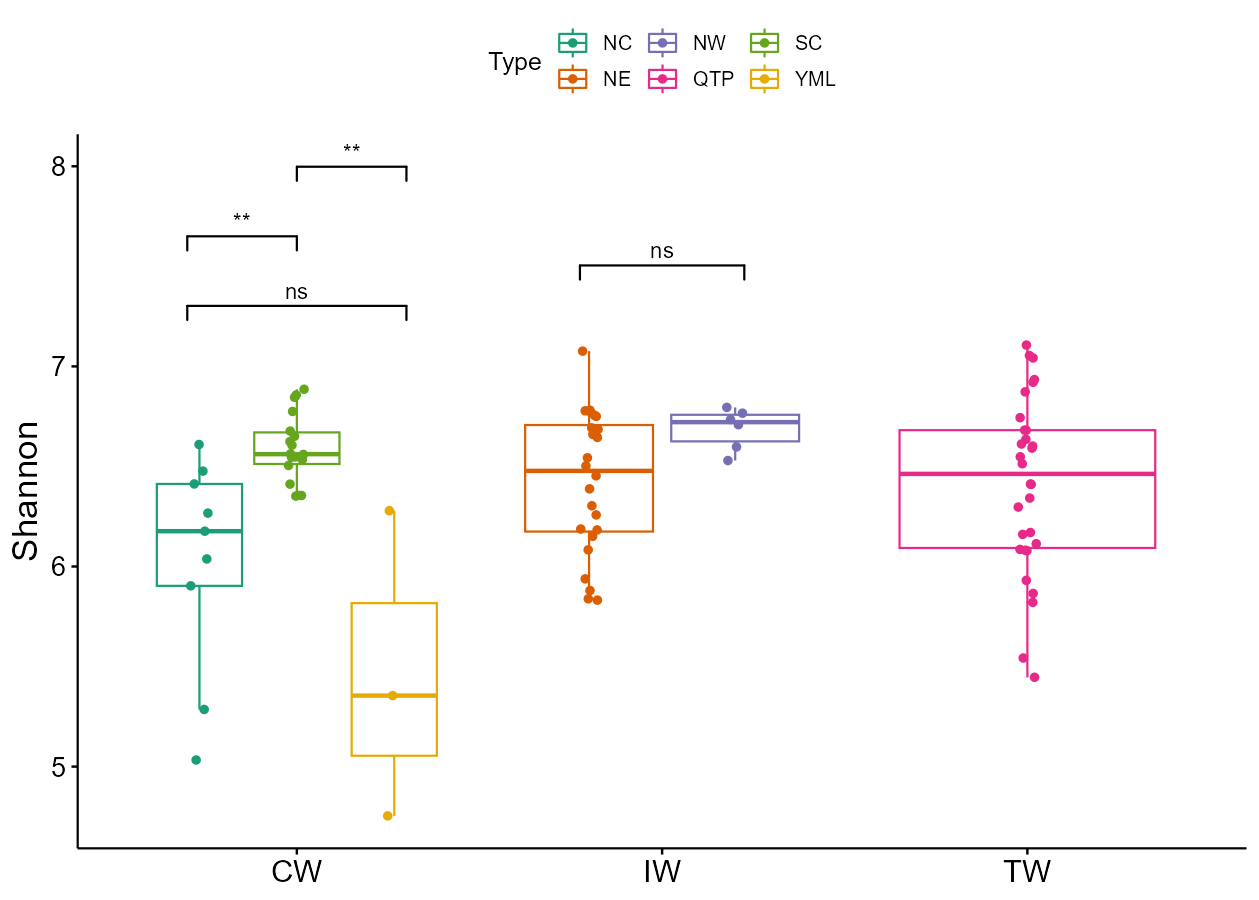
Scheirer Ray Hare test is a nonparametric test that is suitable for a two-way factorial experiment.
t1 <- trans_alpha$new(dataset = mt_rarefied)
# require rcompanion package to be installed
t1$cal_diff(method = "scheirerRayHare", formula = "Group+Type")
Linear mixed-effects model can be selected with the method = "lme".
This model is implemented based on the lmerTest package.
For more parameters, please see lmerTest::lmer function.
Please use parameter passing when more parameters are needed.
For the formula usage, please follow this (https://mspeekenbrink.github.io/sdam-r-companion/linear-mixed-effects-models.html).
In the return table, conditional R2 is the total variance explained by fixed and random effects,
and marginal R2 is the variance explained by fixed effects.
if(!require("lmerTest")) install.packages("lmerTest")
t1 <- trans_alpha$new(dataset = mt_rarefied)
# just using (1|Type) as an example to show the random effect
t1$cal_diff(method = "lme", formula = "Group + (1|Type)")
View(t1$res_diff)
# return_model = TRUE can return original models, i.e. object$res_model
t1$cal_diff(method = "lme", formula = "Group + (1|Type)", return_model = TRUE)
Note that from v1.9.0, the parameter plot_type control which type of plot is employed.
All the options starting with “gg” (e.g., “ggboxplot”, “ggdotplot”, “ggviolin”, “ggstripchart”, “ggerrorplot”) means they are the functions coming from the ggpubr package.
t1 <- trans_alpha$new(dataset = mt_rarefied, group = "Type")
t1$cal_diff(method = "KW_dunn", KW_dunn_letter = TRUE)
t1$plot_alpha(plot_type = "ggboxplot", add = "none")

t1$plot_alpha(plot_type = "ggdotplot")
t1$plot_alpha(plot_type = "ggdotplot", fill = "Type", alpha = 0.3)
t1$plot_alpha(plot_type = "ggdotplot", add = "mean_se")
t1$plot_alpha(plot_type = "ggdotplot", add = c("mean_se", "violin"))
t1$plot_alpha(plot_type = "ggdotplot", add = c("mean_se", "violin"), fill = "Type", alpha = 0.2)

t1$plot_alpha(plot_type = "ggviolin")
t1$plot_alpha(plot_type = "ggviolin", y_increase = 0.4, add = "mean_se")
t1$plot_alpha(plot_type = "ggviolin", fill = "Type", alpha = 0.2, y_increase = 0.4, add = "mean_se", add_sig_text_size = 6)

t1$plot_alpha(plot_type = "ggstripchart", add = "mean_se")

t1$plot_alpha(plot_type = "ggerrorplot")
The option "errorbar" or "barerrorbar" in plot_alpha will invoke the data_stat instead of data_alpha for the Mean±SE (or SD) plot (based on the ggplot2).
The line is optional to be added between points (Mean) for the case with a gradient.
t1 <- trans_alpha$new(dataset = mt_rarefied, group = "Group")
t1$cal_diff(method = "KW_dunn", measure = "Chao1", KW_dunn_letter = TRUE)
t1$plot_alpha(measure = "Chao1")
t1$plot_alpha(plot_type = "errorbar", measure = "Chao1")
t1$plot_alpha(plot_type = "errorbar", measure = "Chao1", y_increase = -0.2)
t1$plot_alpha(plot_type = "errorbar", measure = "Chao1", y_increase = -0.2, add_line = TRUE, line_type = 2, line_alpha = 0.5, errorbar_width = 0.1)
t1$plot_alpha(plot_type = "errorbar", plot_SE = FALSE, measure = "Chao1", y_increase = 0.2, add_line = TRUE, line_type = 2, line_alpha = 0.5, errorbar_width = 0.1)
t1$plot_alpha(plot_type = "barerrorbar", measure = "Chao1")
t1$plot_alpha(plot_type = "barerrorbar", measure = "Chao1", y_increase = -0.3)
t1$plot_alpha(plot_type = "barerrorbar", measure = "Chao1", bar_width = 0.6, errorbar_width = 0.2, errorbar_size = 1, errorbar_addpoint = FALSE)

# by_group example
# use example data in mecoturn package
library(microeco)
library(mecoturn)
library(magrittr)
data(wheat_16S)
wheat_16S$sample_table$Type %<>% factor(., levels = unique(.))
t1 <- trans_alpha$new(dataset = wheat_16S, group = "Region", by_group = "Type")
t1$cal_diff(method = "KW_dunn", measure = "Shannon", KW_dunn_letter = TRUE)
View(t1$res_diff)
t1$plot_alpha(plot_type = "errorbar", measure = "Shannon")
t1$plot_alpha(plot_type = "errorbar", measure = "Shannon", add_line = TRUE, line_type = 2)
t1$plot_alpha(plot_type = "errorbar", plot_SE = FALSE, measure = "Shannon", add_line = TRUE, line_type = 2)
From v1.4.0, the heatmap can be used to visualize the significances for the case with multiple factors in the formula.
t1 <- trans_alpha$new(dataset = mt_rarefied, group = "Group")
t1$cal_diff(method = "anova", formula = "Group+Type+Group:Type")
t1$plot_alpha(color_palette = rev(RColorBrewer::brewer.pal(n = 11, name = "RdYlBu")), trans = "log10")
t1$plot_alpha(color_palette = c("#053061", "white", "#A50026"), trans = "log10")
t1$plot_alpha(color_values = c("#053061", "white", "#A50026"), trans = "log10")
t1$plot_alpha(color_values = c("#053061", "white", "#A50026"), trans = "log10", filter_feature = "", text_y_position = "left")
t1$plot_alpha(color_values = c("#053061", "white", "#A50026"), trans = "log10", filter_feature = "", text_y_position = "left", cluster_ggplot = "row")
5.1.2 Key points
- trans_alpha$new: creating
trans_alphaobject can invokealpha_diversityin microtable for transformation - cal_diff:
formulaparameter applies to multi-factor analysis of variance. - cal_diff: From v1.2.0,
anova_post_testcan be used to change default post test method of anova. - plot_alpha: the significance label comes from the results in
object$res_diff
5.2 trans_beta class
The trans_beta class is specifically designed for the beta diversity analysis, i.e. the dissimilarities among samples. Beta diversity can be defined at different forms(Tuomisto 2010) and can be explored with different ways(Anderson et al. 2011). We encapsulate some commonly-used approaches in microbial ecology(Ramette 2007). Note that the part of beta diversity related with environmental factors are placed into the trans_env class. The distance matrix in beta_diversity list of microtable object will be invoked for transformation and ploting using trans_beta class when needed. The analysis referred to the beta diversity in this class mainly include ordination, group distance, clustering and manova.
5.2.1 Example
The available ordination methods include PCoA (principal coordinates analysis), NMDS (non-metric multidimensional scaling), PCA (principal component analysis), DCA (detrended correspondence analysis) and PLS-DA (partial least squares discriminant analysis).
# create trans_beta object
# For PCoA and NMDS, measure parameter must be provided.
# measure parameter should be either one of names(mt_rarefied$beta_diversity) or a customized symmetric matrix
t1 <- trans_beta$new(dataset = mt_rarefied, group = "Group", measure = "bray")t1$cal_ordination(method = "PCoA")
# t1$res_ordination is the ordination result list
class(t1$res_ordination)
# plot the PCoA result with confidence ellipse
t1$plot_ordination(plot_color = "Group", plot_shape = "Group", plot_type = c("point", "ellipse"))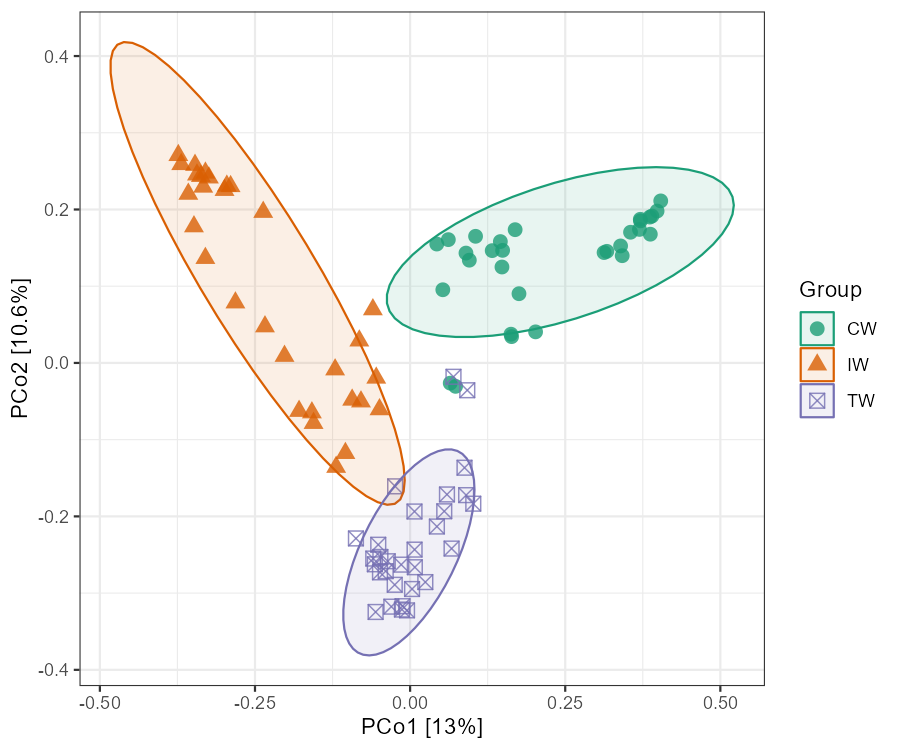
More examples on different options.
t1$plot_ordination(plot_color = "Type", plot_type = "point")
t1$plot_ordination(plot_color = "Group", point_size = 5, point_alpha = .2, plot_type = c("point", "ellipse"), ellipse_chull_fill = FALSE)
t1$plot_ordination(plot_color = "Group", plot_shape = "Group", plot_type = c("point", "centroid"))
t1$plot_ordination(plot_color = "Group", plot_shape = "Group", plot_type = c("point", "ellipse", "centroid"))
t1$plot_ordination(plot_color = "Group", plot_shape = "Group", plot_type = c("point", "chull"))
t1$plot_ordination(plot_color = "Group", plot_shape = "Group", plot_type = c("point", "chull", "centroid"))
t1$plot_ordination(plot_color = "Group", plot_shape = "Group", plot_type = c("chull", "centroid"))
t1$plot_ordination(plot_color = "Group", plot_shape = "Group", plot_type = c("point", "chull", "centroid"), add_sample_label = "SampleID")
t1$plot_ordination(plot_color = "Group", plot_shape = "Group", plot_type = "centroid")
t1$plot_ordination(plot_color = "Group", plot_shape = "Group", plot_type = "centroid", centroid_segment_alpha = 0.9, centroid_segment_size = 1, centroid_segment_linetype = 1)
t1$plot_ordination(plot_type = c("point", "centroid"), plot_color = "Type", centroid_segment_linetype = 1)
t1$plot_ordination(plot_color = "Saline", point_size = 5, point_alpha = .2, plot_type = c("point", "chull"), ellipse_chull_fill = FALSE, ellipse_chull_alpha = 0.1)
t1$plot_ordination(plot_color = "Group") + theme(panel.grid = element_blank()) + geom_vline(xintercept = 0, linetype = 2) + geom_hline(yintercept = 0, linetype = 2)
One example for PCA or DCA with Genus data and loading arrow.
tmp <- mt_rarefied$merge_taxa(taxa = "Genus")
tmp$tax_table %<>% .[.$Genus != "g__", ]
tmp$tidy_dataset()
rownames(tmp$otu_table) <- tmp$tax_table[rownames(tmp$otu_table), "Genus"]
rownames(tmp$tax_table) <- tmp$tax_table[, "Genus"]
t1 <- trans_beta$new(dataset = tmp)
t1$cal_ordination(method = "PCA")
t1$plot_ordination(plot_color = "Group", loading_arrow = TRUE, loading_text_italic = TRUE)
t1$cal_ordination(method = "DCA")
t1$plot_ordination(plot_color = "Group", loading_arrow = TRUE, loading_text_italic = TRUE)
Then we plot and compare the group distances.
t1 <- trans_beta$new(dataset = mt_rarefied, group = "Group", measure = "bray")
# calculate and plot sample distances within groups
t1$cal_group_distance(within_group = TRUE)
# return t1$res_group_distance
# perform Wilcoxon Rank Sum and Signed Rank Tests
t1$cal_group_distance_diff(method = "wilcox")
# plot_group_order parameter can be used to adjust orders in x axis
t1$plot_group_distance(add = "mean")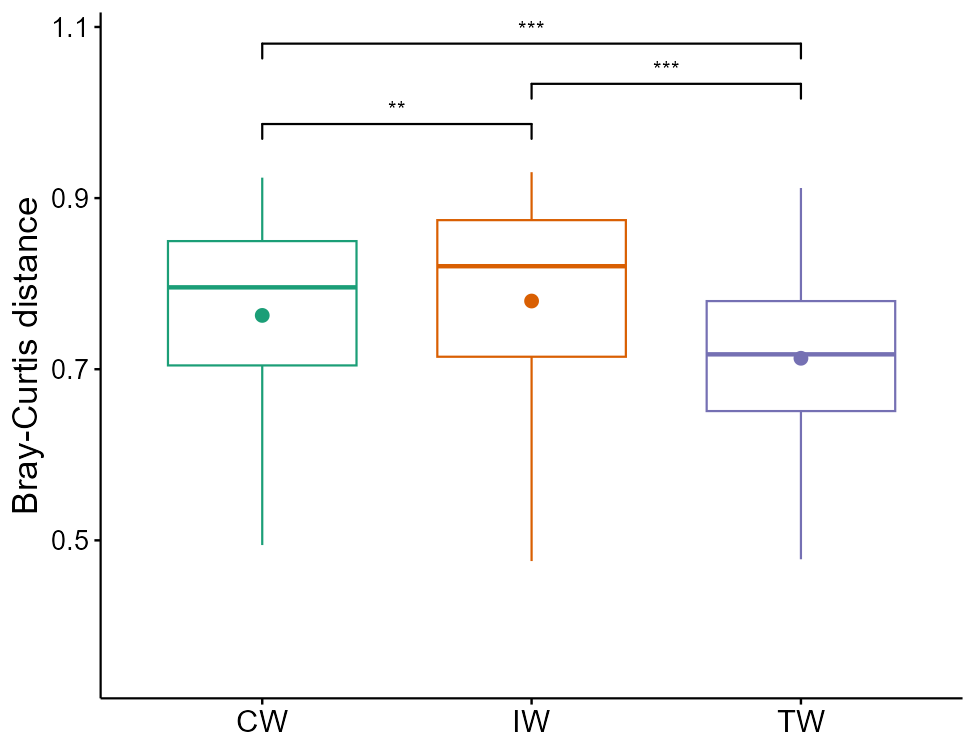
# calculate and plot sample distances between groups
t1$cal_group_distance(within_group = FALSE)
t1$cal_group_distance_diff(method = "wilcox")
# parameters in plot_group_distance function will be passed to the plot_alpha function of trans_alpha class
t1$plot_group_distance(plot_type = "ggviolin", add = "mean_se")
t1$plot_group_distance(add = "mean")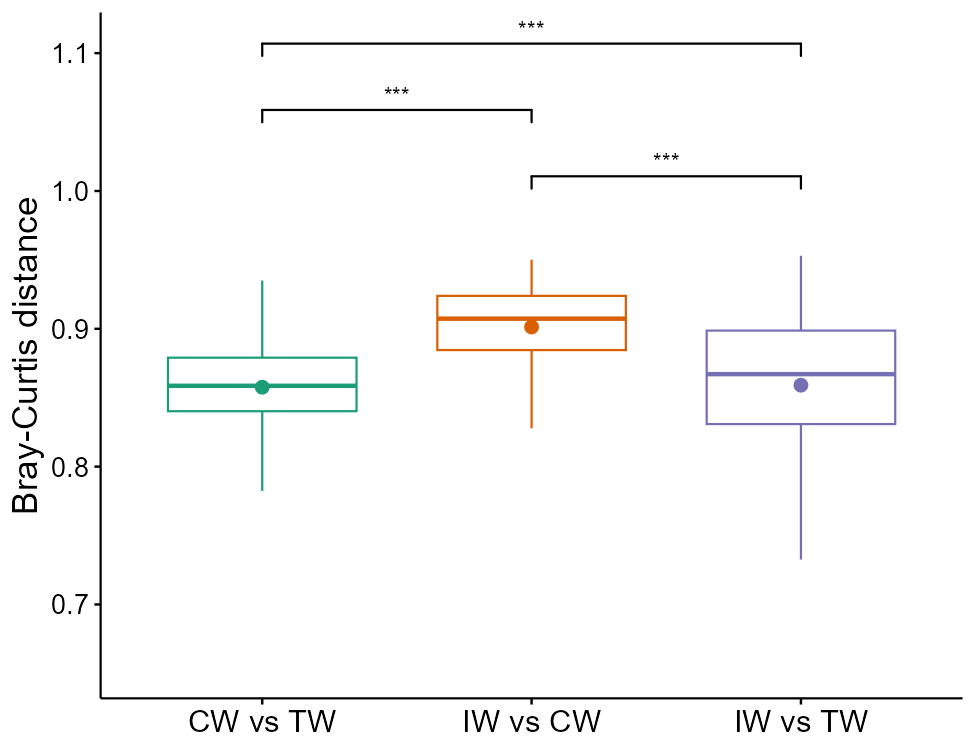
Clustering plot is also a frequently used method.
# extract a part of data
tmp <- clone(mt_rarefied)
tmp$sample_table %<>% subset(Group %in% c("CW", "TW"))
tmp$tidy_dataset()
t1 <- trans_beta$new(dataset = tmp, group = "Group")
# use replace_name to set the label name, group parameter used to set the color
t1$plot_clustering(group = "Type", replace_name = c("Type"))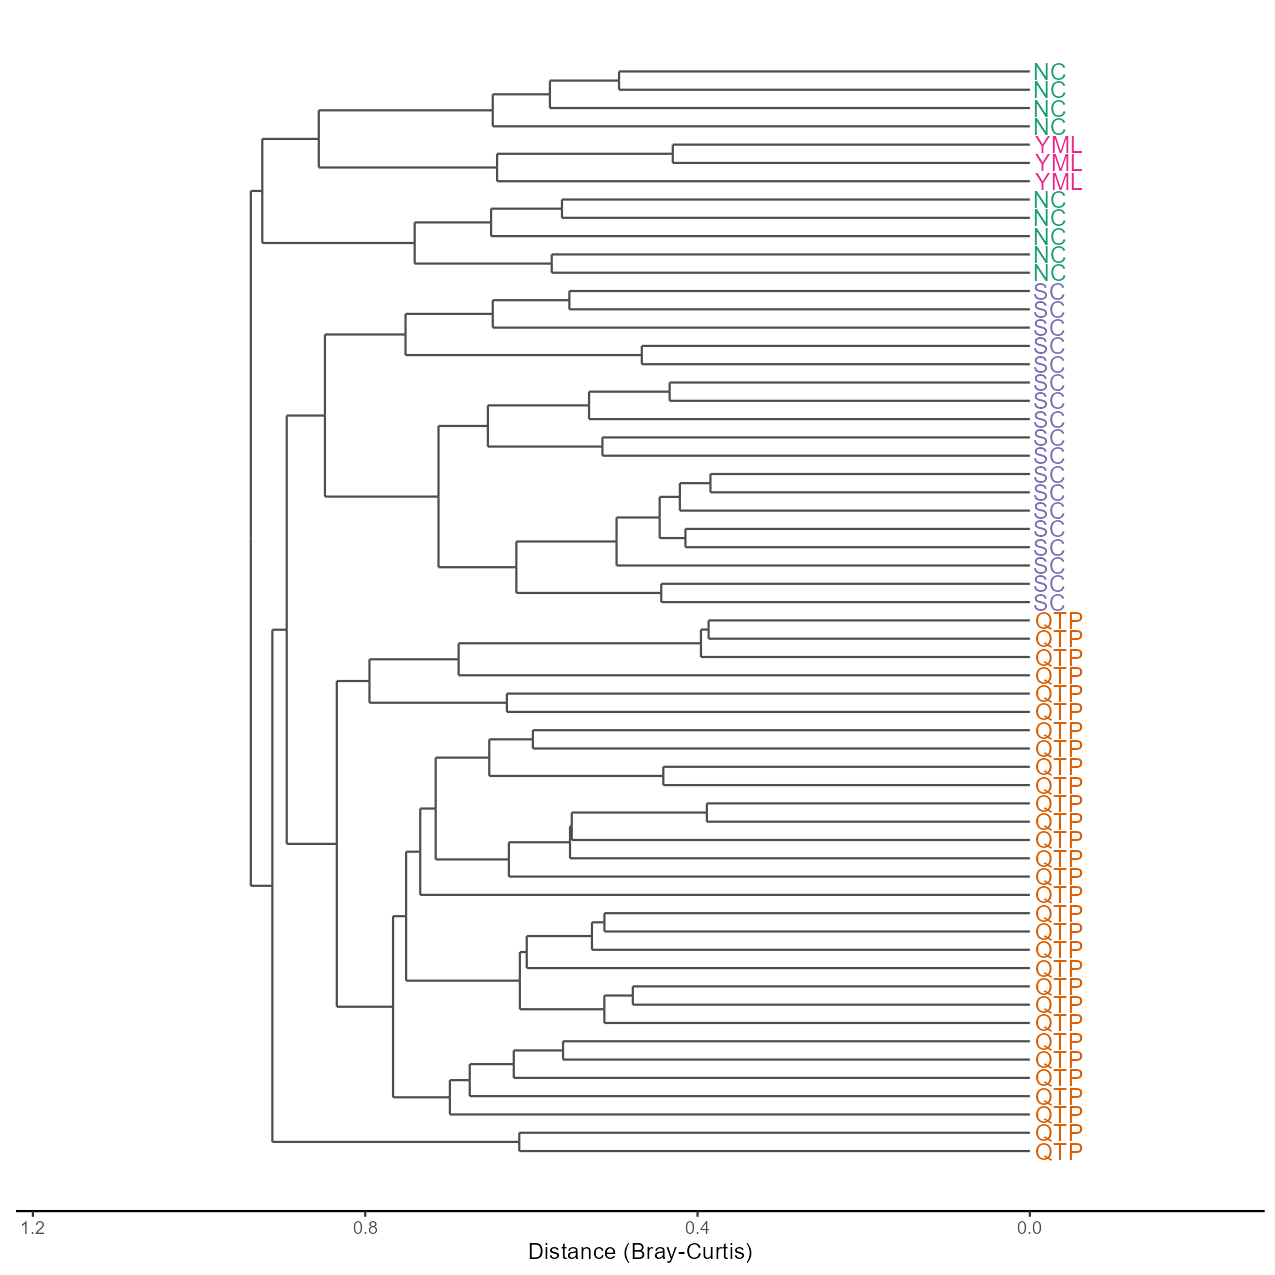
PerMANOVA(Anderson 2001) can be applied to the differential test of distances among groups via the cal_manova function developed
based on the adonis2 function of vegan package.
t1 <- trans_beta$new(dataset = mt_rarefied, group = "Group", measure = "bray")
# manova for all groups when manova_all = TRUE
t1$cal_manova(manova_all = TRUE)
t1$res_manova
## The result is stored in object$res_manova ...| Df | SumOfSqs | R2 | F | Pr(>F) | Significance | |
|---|---|---|---|---|---|---|
| Group | 2 | 6.121 | 0.1955 | 10.57 | 0.001 | *** |
| Residual | 87 | 25.18 | 0.8045 | NA | NA | NA |
| Total | 89 | 31.3 | 1 | NA | NA | NA |
The parameter manova_all = FALSE can make the test switch to paired group comparison.
# manova for each paired groups
t1$cal_manova(manova_all = FALSE)
t1$res_manova
## The result is stored in object$res_manova ...| Groups | measure | F | R2 | p.value | p.adjusted | Significance |
|---|---|---|---|---|---|---|
| IW vs CW | bray | 11.01 | 0.1595 | 0.001 | 0.001 | *** |
| IW vs TW | bray | 9.992 | 0.147 | 0.001 | 0.001 | *** |
| CW vs TW | bray | 10.69 | 0.1556 | 0.001 | 0.001 | *** |
When there are too many comparison pairs or when comparisons are valuable only within certain categories, the by_group parameter can be used.
t1$cal_manova(manova_all = FALSE, group = "Type", by_group = "Group")
t1$res_manova
## For by_group: IW ...## For by_group: CW ...## For by_group: TW ...## Skip by_group: TW, because groups number < 2 ...## The result is stored in object$res_manova ...| by_group | Groups | measure | F | R2 | p.value | p.adjusted |
|---|---|---|---|---|---|---|
| IW | NE vs NW | bray | 4.462 | 0.1375 | 0.001 | 0.001 |
| CW | NC vs YML | bray | 4.077 | 0.2896 | 0.004 | 0.004 |
| CW | NC vs SC | bray | 7.095 | 0.2211 | 0.001 | 0.003 |
| CW | YML vs SC | bray | 4.492 | 0.1912 | 0.003 | 0.004 |
| Significance |
|---|
| *** |
| ** |
| ** |
| ** |
The parameter manova_set has higher priority than manova_all. If manova_set is provided, manova_all parameter will be disabled.
# manova for specified group set: such as "Group + Type"
t1$cal_manova(manova_set = "Group + Type")
t1$res_manova
## The result is stored in object$res_manova ...| Df | SumOfSqs | R2 | F | Pr(>F) | Significance | |
|---|---|---|---|---|---|---|
| Group | 0 | -3.553e-15 | -1.135e-16 | -Inf | NA | NA |
| Type | 3 | 3.783 | 0.1208 | 4.949 | 0.001 | *** |
| Residual | 84 | 21.4 | 0.6836 | NA | NA | NA |
| Total | 89 | 31.3 | 1 | NA | NA | NA |
From v1.0.0, ANOSIM method is also available.
# the group parameter is not necessary when it is provided in creating the object
t1$cal_anosim(group = "Group")
t1$res_anosim
t1$cal_anosim(group = "Group", paired = TRUE)
t1$res_anosimPERMDISP(Anderson et al. 2011) is implemented to test multivariate homogeneity of groups dispersions (variances) based on the betadisper function of vegan package.
# for the whole comparison and for each paired groups
t1$cal_betadisper()
## The result is stored in object$res_betadisper ...t1$res_betadisper##
## Permutation test for homogeneity of multivariate dispersions
## Permutation: free
## Number of permutations: 999
##
## Response: Distances
## Df Sum Sq Mean Sq F N.Perm Pr(>F)
## Groups 2 0.04131 0.0206545 4.1682 999 0.022 *
## Residuals 87 0.43110 0.0049552
## ---
## Signif. codes: 0 '***' 0.001 '**' 0.01 '*' 0.05 '.' 0.1 ' ' 1
##
## Pairwise comparisons:
## (Observed p-value below diagonal, permuted p-value above diagonal)
## CW IW TW
## CW 0.4970000 0.071
## IW 0.4621193 0.006
## TW 0.0566190 0.0050319For the explanation of statistical methods in microbial ecology, please read the references (Ramette 2007; Buttigieg and Ramette 2014).
5.2.2 Key points
- trans_beta$new: creating
trans_betaobject withmeasureparameter can invokebeta_diversityinmicrotableobject for transformation - cal_ordination(): PCoA, PCA and NMDS approaches are all available
- cal_manova():
cal_manovafunction can be used for paired comparisons, overall test and multi-factors test - plot_group_distance(): manipulating
object$res_group_distance_diffcan control what statistical results are presented in the plot.